Visualizing a Changing Region, Block by Block
Race/Ethnicity Trends in the
Atlanta
Baltimore
Boston
Charlotte
Chicago
Detroit
Houston
Los Angeles
Miami
New York
Orlando
Philadelphia
Phoenix
San Francisco
Washington D.C.
Metro Area, 2000 to 2010
Find Address:
About
|
More maps and analysis
|
Link
10% Transparent
Vertical Slider Bar
Side-by-Side
Overlay
Map
Satellite
Tab 1
Tab 2
Tab 3
The map on this side of the divider shows:
Race/Ethnicity by Census Block 2000
The map on this side of the divider shows:
Race/Ethnicity by Census Block 2010
The map on this side of the divider shows:
Race/Ethnicity by Census Block 2000
The map on this side of the divider shows:
Race/Ethnicity by Census Block 2010
Race/Ethnicity by Census Block:
2000
2010
Data from US Census Bureau (PL94-171) analyzed and mapped by
Center for Urban Research
,
CUNY Graduate Center
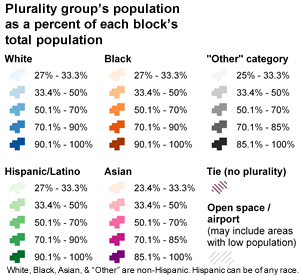
legend
View full version