As researchers have noted (see PDF version of this US2010 report), New York City is one of the most segregated cities in the country. Residential populations across large areas of contiguous Census tracts are dominated by one or another of the City's major racial and ethnic groups, with relatively little racial/ethnic diversity. This is especially true for Whites and Blacks and somewhat less so for Latino and Asian populations. However, a large outflow of White and Black residents between 2000 and 2010 accompanied by a large increase of Asian and Latino residents has changed the racial/ethnic composition of many of the city's established neighborhoods. These changes will have implications for, among other things, legislative redistricting that is now taking place.
This website summarizes New York City's population changes between 2000 and 2010, using maps and data to highlight the residential shifts of racial/ethnic groups across the city. Our maps and data visualize and document these changes in each borough and neighborhood, as well as block by block.
A discussion highlighting these changes is provided below. Interactive features include:
- Block-level maps comparing 2000 and 2010 race/ethnicity patterns within each borough.
- Zoomable maps allowing you to zoom in to specific blocks, click on individual blocks to see population details, and easily move around the New York City metropolitan region -- all while sliding back and forth to compare 2000 and 2010 race/ethnicity patterns on a block-by-block basis. Other cities coming soon!
- A sortable table listing race/ethnicity changes by neighborhood throughout the city.
Note that this narrative refers to "race/ethnicity groups" based on the major categories from the US Census. We used the Census Bureau's mutually exclusive race and Hispanic origin categories as follows: 1) non-Hispanic White; 2) non-Hispanic Black; 3) Hispanic/Latino; 4) non-Hispanic Asian; & 5) all other persons (representing non-Hispanic people who checked two or more races, Native Americans, Hawaiians, or some other race). In reality, these broad categories may not reflect the nuanced, and sometimes striking, demographic and socio-economic differences within these groupings. Throughout this narrative when we refer to White, Black, Asian, and others, we are referring to non-Hispanics. As the Census Bureau points out, people who identified themselves as Hispanic on the census form can be of any race.
The context
New York City's population increased by 2.1% (166,855 people) between 2000 and 2010. However, city officials believe that the Census Bureau undercounted the population primarily in two areas -- southwest Brooklyn and northwest Queens -- and are challenging the overall population count. But even if this challenge succeeds, the official 2010 Census population counts and demographic characteristics at the local level -- for the boroughs, tracts, Census blocks and other geographies within the city -- will not change.
The New York City Planning Department provides several tables showing population changes by borough. On a percentage basis, Staten Island had the largest net population increase (5.6%), followed by the Bronx (3.9%) and Manhattan (3.2%). Queens grew by only 0.1% or 1,343 people, a figure that surprised city officials and residents of the county alike. In absolute terms, the Bronx had the largest net increase (52,458 people), followed by Manhattan (48,678 people) and Brooklyn (39,374 people).
Based on the City Planning Department's analysis [PDF - opens in new window], the White population had a net decline of 2.8% (78,000 people) and now accounts for a third of the city's population. The Black population, for the first time in recent history, declined by 5.1% (100,000 people). In contrast, Asians and Latinos both grew in size, by 248,000 and 175,000 people respectively. Asians now account for close to 13% of the population while Latinos now represent 28.6% of the city's population.
Racial/ethnic enclaves remain, but many are now demographically more mixed
Despite New York City's depiction as a "melting pot," many neighborhoods in the city for years have had little racial/ethnic diversity, predominated by one or another of the major race/ethnicity groups. The latest Census data show that these residential patterns continue -- but the data also reveal important changes.
For this analysis, the Center for Urban Research calculated race/ethnicity plurality for a given area (such as neighborhood, tract, or Census block). Plurality of the population refers to the group with the largest number of people (not necessarily the majority) -- in other words, the predominant subgroup of the area's overall population. We used the Census Bureau's block relationship file to allocate 2000 population counts to 2010 geography. We then calculated the number and percent of people in each of the 5 major race/ethnicity groups (listed in the note above) for each Census block in the city for 2000 and 2010. From there we identified the group with a plurality of each block's population. (Our methodology is explained more fully here.)
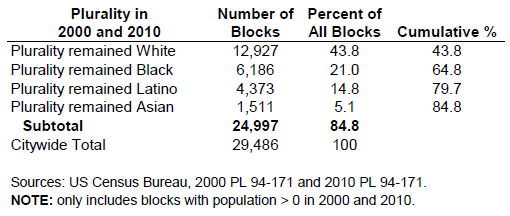
The plurality analysis revealed interesting patterns. For example, of the almost 29,500 Census blocks in the city that had population greater than zero in 2000 and 2010, 85% of them (24,997) had the same predominant racial/ethnic population (i.e., plurality group) in 2010 as they did in 2000. The following table presents this information overall and for each of the major race/ethnicity groups.
Download table (Excel spreadsheet)
return to top
Note that even though the predominant group may be the same, the group's proportion of a block's population may be increasing or decreasing (our maps highlight these types of changes).
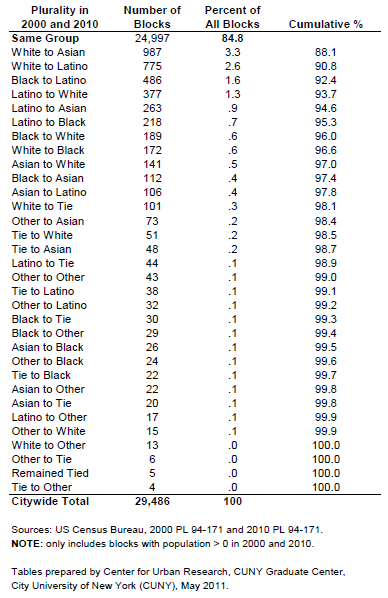
For some blocks, however, population trends shifted the predominant racial/ethnic group from one to another. In the remaining 4,500 or so populated Census blocks, the predominant group changed, for example, from White to Asian, Hispanic to White, etc. The following table lists these shifts, sorted by largest number of blocks with a plurality change to the smallest number. For example, in almost 1,000 Census blocks (3.3% of the total number of populated blocks), the predominant racial/ethnic group shifted from White to Asian.
Download table (Excel spreadsheet)
Changes by borough and neighborhood
The bullet points below summarize some of the more striking changes revealed in the data and the maps. The table following the bullet points presents this information for all neighborhood areas in New York City (using the NYC Department of City Planning's "Neighborhood Tabulation Areas"). A separate set of block-level maps visualize the changing race/ethnicity patterns geographically from 2000 to 2010 within each borough.
The maps and data provided by CUR provide a window into many different narratives and analyses of demographic trends throughout the city. We encourage you to use our materials to illustrate and examine these stories by repurposing our maps and data for your own websites, blogs, publications, and studies. Please contact us if you have any questions about our work, or if we can help in any way.
Manhattan
Overall, the White population grew by 58,000 people between 2000 and 2010. The borough's Asian population grew by 34,333 people. In contrast, the Black and Latino populations declined by 29,000 and 14,000, respectively.
- Central Harlem and adjacent neigborhoods have experienced substantial change. Central Harlem (north and south) grew in population (an increase of 9%, from 109,095 people in 2000 to 118,665 in 2010). But Blacks in this predominantly Black community lost population share. The largest loss of Blacks in Manhattan occurred in Central Harlem North (-5,453) and Central Harlem South (-4,091). The Black population also declined in Hamilton Heights (-5,366).
- At the same time, the White population grew in Central Harlem South and in East Harlem South by 5,600 and 3,600, respectively and increased its share in those neighborhoods to 16% from 3.5% (Central Harlem So) and 17.4% from 11.5% (East Harlem So).
- Latinos also gained population share in this part of upper Manhattan. Latinos gained the most from 2000 to 2010 in Central Harlem North (6,350) and increased their population share in that neighborhood from 16% in 2000 to 23% in 2010.
- These patterns are revealed in the 2000 and 2010 maps of Manhattan above 110th Street. The dark orange-shaded blocks (indicating 90% or more Black population) in Central Harlem north and south in 2000 changed to much lighter shaded blocks in 2010, indicating a more mixed population. Several blocks in Central Harlem South even switched plurality from Black to White or Latino.
- In contrast to increases in upper Manhattan, White population density decreased in neighborhoods with traditionally substantial White concentrations such as the Upper East Side (a 7% loss; almost 3,800 people) and Yorkville (a 4% decline; 2,200 people). Latinos and Asians both had substantial increases in these neighborhoods. The Latino population grew by just over 1,000 people -- 17.5% -- in Yorkville and by 450 people -- 19% -- in the Upper East Side. The Asian population increased by 2,100 people -- 14% -- in Yorkville and by 682 people -- 29% -- in the Upper East Side.
- Though Whites tended to remain the plurality group in these two neighborhoods, the maps reveal that White population losses occurred in many blocks across both neighborhoods.
Bronx
The White population continued its decades-long decline in the Bronx, losing 42,000 residents between 2000 and 2010. The size of the Black population remained essentially the same at about 416,000 people. Asians grew by 8,770 but they were overshadowed by Latinos who grew by almost 100,000 people (96,708).
- The greatest loss of White population occurred in the southeast section of the Bronx with over 7,000 Whites leaving the Throgs Neck Area, followed by Pelham Bay/Country Club (-4,547), Pelham Parkway (-3,536) and Allerton/Pelham Gardens (-3,011).
- Blacks increased their number in Co-op City by 2,705 raising their share of the population in that neighborhood to 60.5% from 58.4%. The greatest Black population losses occurred in the north central part of the Bronx. Approximately 8,500 Black residents left 3 neighborhoods: Kingsbridge Heights, East Concourse/Concourse Village and University Heights-Morris Heights.
- Among the largest increases of Latinos was in Schuylerville/Throgs Neck (increase of 6,076), a neighborhood in the southeast section of Bronx that had a predominantly White population in 2000. This area declined by 7,000 Whites. In contrast, in the south central part of the Bronx, Morrisania & Melrose (with sizeable Black populations in 2000: 45%), the Latino population grew by 6,658 and the Latino share of the area increased from 52% to 58% in 2010.
- The Latino number and share of the population also grew in the East Concourse/Concourse Village, Williamsbridge, Highbridge, Melrose South/Mott Haven, Soundview-Castle Hill and University Heights.
Brooklyn
Overall, Brooklyn's population grew by 39,000 people. The White population grew by 38,774 while the Asian population increased by 75,838. Blacks lost almost 50,000 people (-49,517).
- Black losses were substantial in several communities with historically large Black populations. The Black population declined by 10,000 in Crown Heights North (a loss of almost 12% of the Black population), 8,400 people in Flatbush (decline of 14%), 7,258 people in Prospect-Lefferts Gardens (decline of 12%), and almost 6,000 people (-5,936) in Bedford (decline of almost 15%). [Note: The City Planning Department created two separate "neighborhood areas" for the community commonly referred to as Bedford-Stuyvesant. We use the Planning Department's "neighborhood area" delineation for this analysis.]
- Communities in northern Brooklyn such as Bedford, Prospect Heights, Fort Greene, and Clinton Hill in 2000 straddled the area of central Brooklyn with substantial Black population plurality and the Park Slope/Brooklyn Heights area with substantial White population plurality. By 2010, Black population concentration had declined and White concentration had increased. In Bedford, the White population had the greatest percentage increase of any of the major groups citywide -- 633% (an increase of almost 16,000 people), increasing the White population share in that neighborhood from 4% in 2000 to 25.5% in 2010. In Prospect Heights, the White population share increased from just over one-quarter in 2000 (28.2%) to almost half (47.2%) in 2010 (an increase of 3,818). In Clinton Hill, the White population share more than doubled from 15% in 2000 to just over 35% in 2010 (an increase of 7,419).
- The maps help confirm these changes visually, revealing a lighter set of color shades (i.e., a greater demographic mix) in 2010 than in 2000 for each of these communities.
- Similarly, Whites increased their number in what the Planning Department refers to as Williamsburg-North Side/South Side by 10,245 and their share of the population from 34% to 52%. The Latino population declined in this neighborhood by almost 25% (from a population share in 2000 of 57% -- 22,923 people -- to just under 38% in 2010 (17,268). Whites also increase their presence in Williamsburg (5,041) and East Williamsburg (4,444).
- In contrast, Black population share increased in the southeast Brooklyn neighborhoods of Canarsie and Flatlands, growing by almost 10,500 (an 18% increase) in Canarsie and almost 2,500 (a 6% increase) in Flatlands. The White population in these neighborhoods fell by 8,473 (Canarsie) and 5,052 (Flatlands). The maps also reveal these shifts.
- Southwest Brooklyn also experienced substantial changes, though this is one of two areas in the city that the Dept of City Planning argues was undercounted by the Census Bureau.
- Nonetheless, Bensonhurst (east and west) each with a substantial White population in 2000 had lost close to 18,000 Whites by 2010. In that time the Asian population increased by a greater amount (19,747 people, or 57%). The maps highlight the growth of the area with substantial Asian population pluralities from Sunset Park East along the N subway line through Dyker Heights and Bensonhurst.
Queens
The White population in Queens declined by over 116,000 people while the Asian population increased by an equivalent amount (119,000). The Latino population in Queens also increased, though by a smaller amount (57,145 people), while the Black population declined by 26,950 people.
Many Queens neighborhoods experienced demographic shifts between 2000 and 2010. The examples below only represent several highlights.
- Whites declined in many Queens neighborhoods with large White population pluralities
in 2000, such as:
-
3 northern Queens neighborhoods on the Nassau County border
- Douglaston-Little Neck (White population declined almost 20%, a net loss of 3,207 Whites - it was 67% White in 2000, falling to 53% in 2010),
- Glen Oaks (White population declined almost 21%, a net loss of 2,862 Whites - it was 61% White in 2000, falling to 48% in 2010), and
- Bellerose (White population declined 35%, a net loss of 4,322 Whites - it was just over 50% White in 2000, falling to 31.5% in 2010).
- The concentration of Asians in the Flushing area of Queens grew substantially between
2000 and 2010. In Flushing itself, the
Asian population grew by 37% (13,469 people) - it was 52% Asian in 2000 and grew
to 69% in 2010. The growth in Asian population also extended beyond Flushing's borders,
such as:
-
the 3 neighborhoods adjacent to Flushing
- Murray Hill (the Asian population grew by 32%, a net increase of 6,597 - it was 39% Asian in 2000, growing to 52% in 2010),
- East Flushing (the Asian population grew by 44.5%, a net gain of 4,889 Asians - it was just over 41% Asian in 2000, growing to 59% in 2010), and
- Queensboro Hill (the Asian population grew by 45%, a net increase of 4,196 - it was 48% Asian in 2000, growing to 65% in 2010).
- The concentration of Blacks declined in several areas with high Black population
proportions, especially in southeastern Queens. For example:
- Baisley Park (the Black population declined 15.6%, a net loss of 4,927 Blacks - it was just over 88% Black in 2000, falling to 77% in 2010), and
- South Jamaica (the Black population declined 46.45%, a net loss of 1,922 - it was 85% Black in 2000, falling to 72% in 2010).
- The Black population also fell substantially in East Elmhurst. The core of East Elmhurst was home to a Black population plurality in 2000. But by 2010 the blocks in this area had switched to predominantly Hispanic. Overall in East Elmhurst, the Black population fell by 42.7% (Blacks accounted for 48.3% of the neighborhood in 2000, down to 25.4% in 2010). The Hispanic population grew by 67% (representing 42% of the neighborhood in 2000, up to 64% in 2010).
- Latinos grew the most in Corona (9,500) and North Corona (7,300) increasing their share from 52% to 63% and 78 to 85%, respectively. The Latino population also grew in Woodhaven, East Elmhurst, Glendale, and College Point and almost doubled their presence from 8% to 15% in South Jamaica.
Staten Island
Staten Island grew by 25,000 residents but Whites declined by 16,000. Latinos grew the most 27,500 followed by Asians. Much of the Island's racial/ethnic demographic changes occurred on the North Shore.
Race/Ethnicity Population by Neighborhood: 2000 to 2010 (see note below)
TIP! Sort multiple columns simultaneously by holding down the shift key and clicking a second, third or even fourth column header. For example, to sort within each borough, click Borough then hold shift and click % Chg from 2000.
DOWNLOAD The entire combined table below can be downloaded as an Excel file here.
| Borough | DCP Code | Neighborhood Area (see note below) | 2010 Population | Change from 2000 | % Chg from 2000 |
|---|---|---|---|---|---|
| Manhattan | MN25 | BatteryParkCity-LowerManhattan | 39699 | 19609 | 97.6% |
| Staten Island | SI11 | Charleston-RichmondVly-Tottenvil | 23313 | 4981 | 27.2% |
| Bronx | BX35 | Morrisania - Melrose | 37865 | 8067 | 27.1% |
| Manhattan | MN13 | HudsonYds-Chelsea-Flatiron-UnionSq | 70150 | 14309 | 25.6% |
| Brooklyn | BK75 | Bedford | 70713 | 11486 | 19.4% |
| Bronx | BX34 | Melrose South - Mott Haven North | 39214 | 6024 | 18.2% |
| Queens | QN12 | Hammels-Arverne-Edgemere | 36885 | 5246 | 16.6% |
| Manhattan | MN24 | SoHo-Tribeca-CivicCenter-LittleItaly | 42742 | 5985 | 16.3% |
| Brooklyn | BK73 | North Side - South Side | 45774 | 5644 | 14.1% |
| Bronx | BX33 | Longwood | 26196 | 3114 | 13.5% |
| Queens | QN23 | College Point | 24275 | 2869 | 13.4% |
| Staten Island | SI08 | GrymesHill-Clifton-FoxHills | 22460 | 2630 | 13.3% |
| Manhattan | MN15 | Clinton | 45884 | 5289 | 13% |
| Staten Island | SI12 | MarinrsHbr-Arlingtn-PtIvory-Granitvl | 31474 | 3519 | 12.6% |
| Bronx | BX75 | Crotona Park East | 20277 | 2205 | 12.2% |
| Staten Island | SI28 | Port Richmond | 20191 | 2150 | 11.9% |
| Brooklyn | BK38 | DUMBO-VingrHl-DwntnBrkl-BoermHl | 34495 | 3646 | 11.8% |
| Brooklyn | BK78 | Bushwick South | 72101 | 7485 | 11.6% |
| Bronx | BX26 | Highbridge | 37727 | 3884 | 11.5% |
| Manhattan | MN14 | Lincoln Square | 61489 | 6251 | 11.3% |
| Manhattan | MN11 | Central Harlem South | 43383 | 4310 | 11% |
| Manhattan | MN17 | Midtown - Midtown South | 28630 | 2823 | 10.9% |
| Queens | QN25 | Corona | 57658 | 5578 | 10.7% |
| Queens | QN01 | South Jamaica | 38894 | 3713 | 10.6% |
| Bronx | BX17 | East Tremont | 43423 | 4143 | 10.5% |
| Brooklyn | BK82 | East New York (part A) | 91958 | 8683 | 10.4% |
| Bronx | BX01 | Claremont - Bathgate | 31078 | 2929 | 10.4% |
| Queens | QN26 | North Corona | 52037 | 4881 | 10.4% |
| Manhattan | MN50 | StuyvesantTown-CooperVillage | 21049 | 1952 | 10.2% |
| Staten Island | SI32 | Rossville - Woodrow | 20763 | 1877 | 9.9% |
| Brooklyn | BK34 | Sunset Park East | 72340 | 6191 | 9.4% |
| Queens | QN27 | East Elmhurst | 23150 | 1967 | 9.3% |
| Staten Island | SI37 | Stapleton - Rosebank | 26453 | 2105 | 8.6% |
| Bronx | BX27 | Hunts Point | 27204 | 2062 | 8.2% |
| Staten Island | SI45 | New Dorp - Midland Beach | 21896 | 1654 | 8.2% |
| Staten Island | SI36 | OldTown-DonganHills-SouthBeach | 24835 | 1822 | 7.9% |
| Brooklyn | BK30 | Dyker Heights | 42419 | 3087 | 7.8% |
| Bronx | BX37 | VanNest-MorrisPk-WestchesterSq | 29250 | 2126 | 7.8% |
| Queens | QN62 | Queensboro Hill | 20800 | 1491 | 7.7% |
| Bronx | BX13 | Co-Op City | 43752 | 3074 | 7.6% |
| Brooklyn | BK29 | Bensonhurst East | 62978 | 4412 | 7.5% |
| Manhattan | MN03 | CentrlHarlemNorth-PoloGrounds | 75282 | 5260 | 7.5% |
| Queens | QN38 | Pomonok-FlushngHts-Hillcrest | 34034 | 2301 | 7.3% |
| Brooklyn | BK90 | East Williamsburg | 34158 | 2284 | 7.2% |
| Bronx | BX39 | Mott Haven - Port Morris | 52413 | 3387 | 6.9% |
| Manhattan | MN21 | Gramercy | 27988 | 1804 | 6.9% |
| Bronx | BX44 | Williamsbridge - Olinville | 61321 | 3901 | 6.8% |
| Queens | QN03 | SpringfieldGrdns S-Brookvi | 20132 | 1182 | 6.2% |
| Brooklyn | BK85 | East New York (part B) | 29343 | 1719 | 6.2% |
| Brooklyn | BK79 | Ocean Hill | 31935 | 1868 | 6.2% |
| Bronx | BX09 | Soundview-CastleHill-ClasonPt-HardngPk | 53686 | 2951 | 5.8% |
| Bronx | BX59 | Westchester - Unionport | 27248 | 1480 | 5.7% |
| Manhattan | MN22 | East Village | 44136 | 2390 | 5.7% |
| Bronx | BX14 | EastConcourse - ConcourseVillage | 62284 | 3324 | 5.6% |
| Brooklyn | BK45 | Grgetwn-MarinePk-BergnBeach-MillBasin | 45231 | 2392 | 5.6% |
| Queens | QN30 | Maspeth | 30516 | 1611 | 5.6% |
| Staten Island | SI14 | Grasmere-Arrochar-FtWadsworth | 16079 | 838 | 5.5% |
| Bronx | BX06 | Belmont | 27378 | 1412 | 5.4% |
| Manhattan | MN31 | Lenox Hill - Roosevelt Island | 80771 | 4140 | 5.4% |
| Staten Island | SI22 | WstNewBrightn-NewBrightn-StGrge | 33551 | 1700 | 5.3% |
| Staten Island | SI01 | Annadale-Huguent-PrincesBay-Eltingvl | 27770 | 1404 | 5.3% |
| Brooklyn | BK88 | Borough Park | 106357 | 5302 | 5.2% |
| Bronx | BX40 | Fordham South | 28262 | 1382 | 5.1% |
| Queens | QN10 | BrzyPt-BlleHrbr-RockwyPk-BrdChnl | 28018 | 1311 | 4.9% |
| Brooklyn | BK28 | Bensonhurst West | 88727 | 4087 | 4.8% |
| Manhattan | MN20 | Murray Hill - Kips Bay | 50742 | 2323 | 4.8% |
| Brooklyn | BK27 | Bath Beach | 29931 | 1359 | 4.8% |
| Queens | QN50 | Elmhurst - Maspeth | 25521 | 1155 | 4.7% |
| Queens | QN53 | Woodhaven | 56674 | 2525 | 4.7% |
| Queens | QN19 | Glendale | 32496 | 1425 | 4.6% |
| Brooklyn | BK69 | Clinton Hill | 34791 | 1499 | 4.5% |
| Staten Island | SI35 | New Brighton - Silver Lake | 17525 | 744 | 4.4% |
| Queens | QN37 | Kew Gardens Hills | 37479 | 1428 | 4% |
| Queens | QN22 | Flushing | 72008 | 2646 | 3.8% |
| Queens | QN61 | Jamaica | 53751 | 1902 | 3.7% |
| Bronx | BX07 | Bronxdale | 35538 | 1230 | 3.6% |
| Queens | QN15 | Far Rockaway - Bayswater | 50058 | 1712 | 3.5% |
| Queens | QN43 | Bellerose | 25287 | 829 | 3.4% |
| Brooklyn | BK32 | Sunset Park West | 54041 | 1729 | 3.3% |
| Manhattan | MN09 | Morningside Heights | 55929 | 1721 | 3.2% |
| Manhattan | MN19 | Turtle Bay - East Midtown | 51231 | 1496 | 3% |
| Queens | QN63 | Woodside | 45099 | 1261 | 2.9% |
| Brooklyn | BK35 | Stuyvesant Heights | 63504 | 1677 | 2.7% |
| Queens | QN41 | Fresh Meadows - Utopia | 17812 | 439 | 2.5% |
| Brooklyn | BK23 | West Brighton | 17750 | 381 | 2.2% |
| Queens | QN31 | HuntersPt-Sunnyside-WestMaspeth | 63271 | 1323 | 2.1% |
| Brooklyn | BK72 | Williamsburg | 32926 | 653 | 2% |
| Brooklyn | BK77 | Bushwick North | 57138 | 1045 | 1.9% |
| Manhattan | MN33 | East Harlem South | 57902 | 1005 | 1.8% |
| Queens | QN52 | East Flushing | 26982 | 466 | 1.8% |
| Bronx | BX46 | Parkchester | 29821 | 464 | 1.6% |
| Queens | QN45 | DouglasManor-Douglston-LittleNeck | 24739 | 381 | 1.6% |
| Queens | QN56 | Ozone Park | 21376 | 325 | 1.5% |
| Manhattan | MN32 | Yorkville | 77942 | 1174 | 1.5% |
| Manhattan | MN34 | East Harlem North | 58019 | 866 | 1.5% |
| Brooklyn | BK09 | Brooklyn Heights - Cobble | 22887 | 339 | 1.5% |
| Queens | QN42 | Oakland Gardens | 28237 | 395 | 1.4% |
| Bronx | BX55 | Soundview - Bruckner | 35634 | 497 | 1.4% |
| Bronx | BX31 | Allerton - Pelham Gardens | 28903 | 396 | 1.4% |
| Bronx | BX08 | West Farms - Bronx River | 35011 | 474 | 1.4% |
| Queens | QN35 | Briarwood - Jamaica Hill | 39138 | 513 | 1.3% |
| Staten Island | SI07 | Westerleigh | 24102 | 312 | 1.3% |
| Brooklyn | BK40 | Windsor Terrace | 20988 | 209 | 1% |
| Bronx | BX52 | Schuylerville-ThrogsNeck-EdgwaterPk | 44167 | 434 | 1% |
| Brooklyn | BK64 | Prospect Heights | 19849 | 194 | 1% |
| Manhattan | MN28 | Lower East Side | 72957 | 706 | 1% |
| Staten Island | SI48 | Arden Heights | 25238 | 244 | 1% |
| Bronx | BX29 | Spuyten Duyvil - Kingsbridge | 30161 | 287 | 1% |
| Brooklyn | BK19 | Brighton Beach | 35547 | 304 | 0.9% |
| Queens | QN21 | Middle Village | 37929 | 299 | 0.8% |
| Staten Island | SI05 | NewSprngvil-Bloomfld-Travis | 39597 | 290 | 0.7% |
| Queens | QN44 | GlenOaks-FloralPk-NewHydePk | 22571 | 147 | 0.7% |
| Brooklyn | BK26 | Gravesend | 29436 | 181 | 0.6% |
| Brooklyn | BK37 | Park Slope - Gowanus | 67649 | 386 | 0.6% |
| Brooklyn | BK83 | Cypress Hills - City Line | 49223 | 262 | 0.5% |
| Queens | QN29 | Elmhurst | 88427 | 462 | 0.5% |
| Bronx | BX49 | Pelham Parkway | 30073 | 62 | 0.2% |
| Brooklyn | BK33 | CarrollGrdns-Columbia-RedHook | 38353 | 26 | 0.1% |
| Queens | QN54 | Richmond Hill | 62982 | -3 | 0% |
| Brooklyn | BK17 | SheepshdBay-GerritsenBeach-ManhattanBeach | 64518 | -80 | -0.1% |
| Brooklyn | BK41 | Kensington - Ocean Parkway | 36891 | -46 | -0.1% |
| Queens | QN02 | Springfield Gardens North | 25409 | -32 | -0.1% |
| Staten Island | SI24 | TdtHll-EmrsnHl-HrtlndVillg-LghthseHl | 30714 | -40 | -0.1% |
| Queens | QN20 | Ridgewood | 69317 | -139 | -0.2% |
| Bronx | BX36 | University Heights - Morris Heights | 54188 | -146 | -0.3% |
| Brooklyn | BK61 | Crown Heights North | 103169 | -293 | -0.3% |
| Brooklyn | BK44 | Madison | 38917 | -159 | -0.4% |
| Bronx | BX22 | NorthRiverdale-Fieldston-Riverdale | 27860 | -151 | -0.5% |
| Bronx | BX43 | Norwood | 40494 | -258 | -0.6% |
| Bronx | BX63 | West Concourse | 39282 | -272 | -0.7% |
| Staten Island | SI25 | Oakwood - Oakwood Beach | 22049 | -213 | -1% |
| Bronx | BX28 | Van Cortlandt Village | 50100 | -509 | -1% |
| Queens | QN48 | Auburndale | 19996 | -205 | -1% |
| Brooklyn | BK46 | Ocean Parkway South | 20299 | -257 | -1.3% |
| Queens | QN46 | Bayside - Bayside Hills | 43808 | -566 | -1.3% |
| Brooklyn | BK81 | Brownsville | 58300 | -799 | -1.4% |
| Brooklyn | BK31 | Bay Ridge | 79371 | -1168 | -1.5% |
| Queens | QN17 | Forest Hills | 83728 | -1350 | -1.6% |
| Bronx | BX41 | Mount Hope | 51807 | -842 | -1.6% |
| Brooklyn | BK50 | Canarsie | 83693 | -1365 | -1.6% |
| Queens | QN05 | Rosedale | 25063 | -412 | -1.6% |
| Bronx | BX05 | Bedford Pk - Fordham North | 54415 | -914 | -1.7% |
| Queens | QN49 | Whitestone | 30773 | -579 | -1.8% |
| Bronx | BX10 | PelhamBay-CountryClub-CityIsland | 26583 | -557 | -2.1% |
| Queens | QN06 | Jamaica Estates-Holliswood | 25480 | -581 | -2.2% |
| Staten Island | SI54 | Great Kills | 40720 | -956 | -2.3% |
| Queens | QN07 | Hollis | 20269 | -478 | -2.3% |
| Manhattan | MN23 | West Village | 66880 | -1603 | -2.3% |
| Bronx | BX30 | Kingsbridge Heights | 32496 | -790 | -2.4% |
| Queens | QN51 | Murray Hill | 51739 | -1269 | -2.4% |
| Bronx | BX62 | Woodlawn - Wakefield | 42483 | -1100 | -2.5% |
| Bronx | BX03 | Eastchester-Edenwald-Baychester | 34517 | -899 | -2.5% |
| Queens | QN60 | Kew Gardens | 23278 | -610 | -2.6% |
| Queens | QN08 | St. Albans | 48593 | -1453 | -2.9% |
| Brooklyn | BK58 | Flatlands | 64762 | -1977 | -3% |
| Brooklyn | BK25 | Homecrest | 44316 | -1363 | -3% |
| Queens | QN76 | Baisley Park | 34603 | -1125 | -3.1% |
| Manhattan | MN12 | Upper West Side | 132378 | -4577 | -3.3% |
| Queens | QN71 | Old Astoria | 27814 | -1032 | -3.6% |
| Queens | QN18 | Rego Park | 28260 | -1113 | -3.8% |
| Queens | QN55 | South Ozone Park | 75878 | -3027 | -3.8% |
| Manhattan | MN40 | UpperEastSide - CarnegieHill | 61207 | -2457 | -3.9% |
| Manhattan | MN04 | Hamilton Heights | 48520 | -2035 | -4% |
| Brooklyn | BK60 | Prospect-LeffertsGrdn-Wing | 67459 | -2841 | -4% |
| Queens | QN47 | FtTotten-BayTerrace-Clearview | 21751 | -980 | -4.3% |
| Brooklyn | BK96 | Rugby - Remsen Village | 55326 | -2610 | -4.5% |
| Brooklyn | BK42 | Flatbush | 105804 | -5062 | -4.6% |
| Queens | QN28 | Jackson Heights | 108152 | -5175 | -4.6% |
| Brooklyn | BK95 | Erasmus | 29938 | -1454 | -4.6% |
| Brooklyn | BK43 | Midwood | 52835 | -2605 | -4.7% |
| Manhattan | MN01 | Marble Hill - Inwood | 46746 | -2343 | -4.8% |
| Queens | QN68 | Qnsbridge-Ravenswd-LongIslandCityN | 20030 | -1072 | -5.1% |
| Queens | QN66 | Laurelton | 24453 | -1324 | -5.1% |
| Brooklyn | BK63 | Crown Heights South | 39670 | -2700 | -6.4% |
| Brooklyn | BK21 | Seagate - Coney Island | 31965 | -2302 | -6.7% |
| Queens | QN57 | Lindenwood - Howard Beach | 26148 | -1974 | -7% |
| Manhattan | MN06 | Manhattanville | 22950 | -1825 | -7.4% |
| Brooklyn | BK68 | Fort Greene | 26079 | -2253 | -8% |
| Brooklyn | BK76 | Greenpoint | 34719 | -3102 | -8.2% |
| Manhattan | MN35 | Washington Heights North | 67136 | -6321 | -8.6% |
| Manhattan | MN27 | Chinatown | 47844 | -4528 | -8.6% |
| Brooklyn | BK93 | Starrett City | 13354 | -1265 | -8.7% |
| Queens | QN34 | Queens Village | 52504 | -5201 | -9% |
| Manhattan | MN36 | Washington Heights South | 84438 | -9233 | -9.9% |
| Brooklyn | BK91 | East Flatbush - Farragut | 50355 | -5671 | -10.1% |
| Queens | QN33 | Cambria Heights | 18677 | -2302 | -11% |
| Queens | QN72 | Steinway | 47534 | -6070 | -11.3% |
| Queens | QN70 | Astoria | 78793 | -10325 | -11.6% |
| Bronx | BX98 | Rikers Island | 11091 | -1684 | -13.2% |
return to table